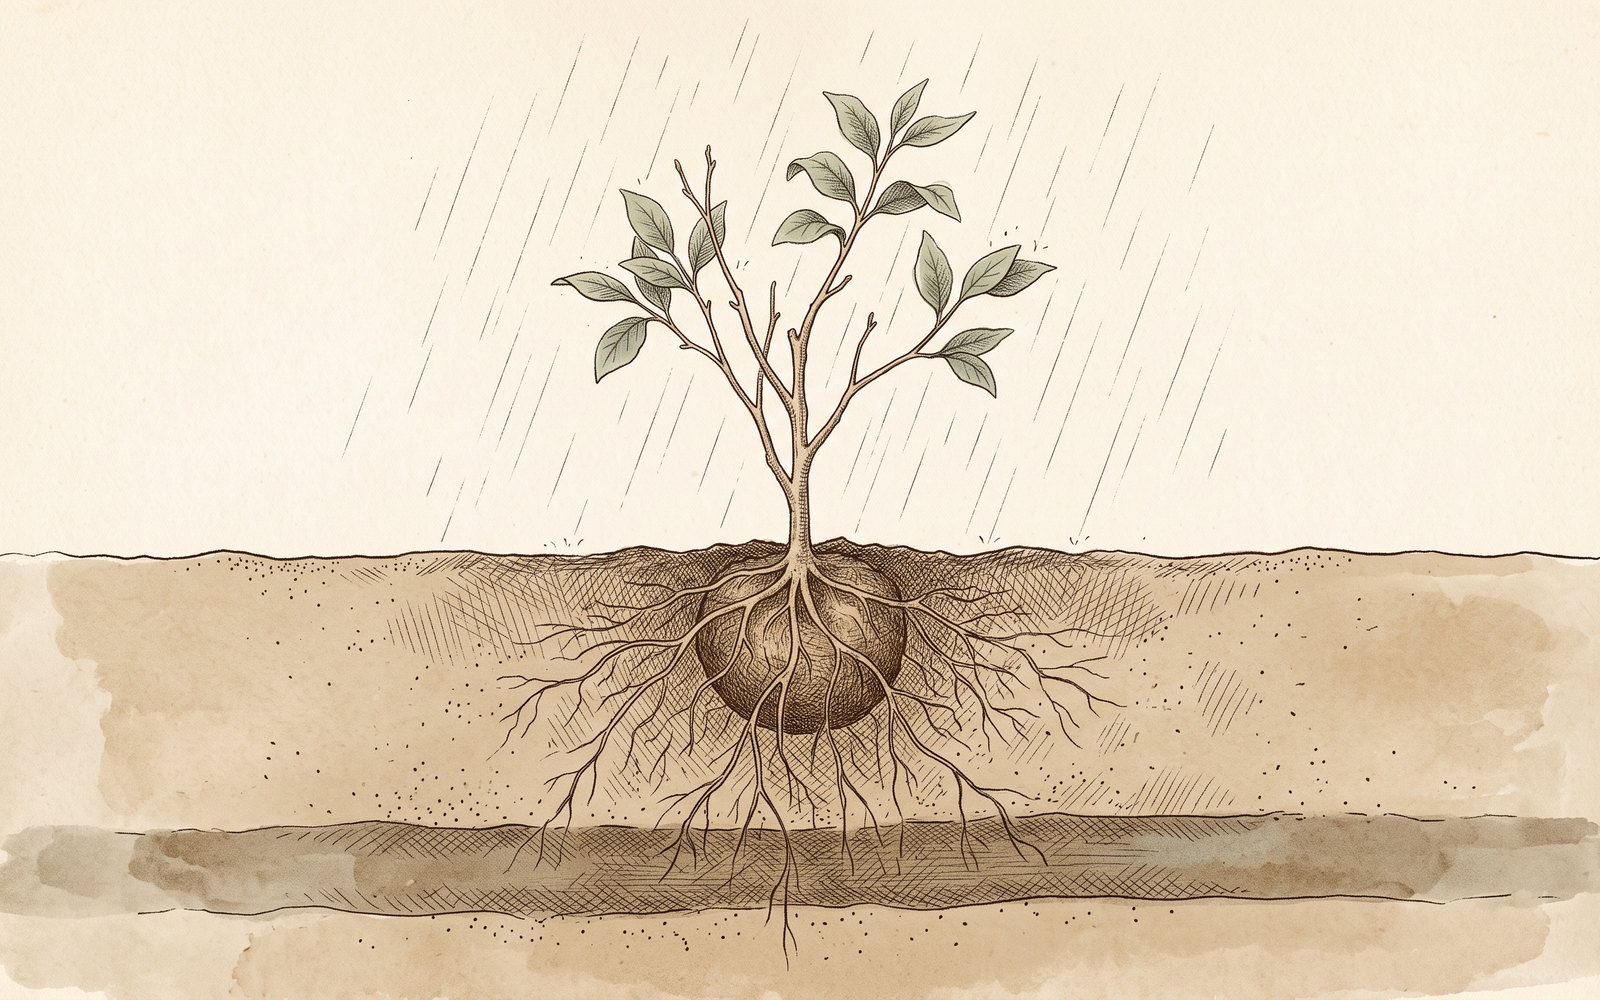
Soil does not hold summer's warmth for months at the depths your plants occupy. It holds it for nine days at 8 inches and two and a half weeks at 20. Here's the measured record, our arithmetic on it, and what it can't tell you.
The claim goes like this: soil holds summer's warmth deep into autumn. It usually arrives with a number attached, three months behind the air at five feet, six months at fifteen. I couldn't find a source for either figure.
Here's what a measured California record shows at the depths a garden plant actually occupies. If you want the practical version of the argument this sits under, that's our fall planting piece. This one is the measurement under its most-repeated claim, which is also the one that doesn't survive checking.
The Record, and How to Read It
The USDA Natural Resources Conservation Service (NRCS) runs the Soil Climate Analysis Network (SCAN). One of its stations sits at Vallecitos in San Benito County, logging soil temperature at 2, 4, 8, 20, and 40 inches (5, 10, 20, 50, and 100 cm) alongside daily mean air temperature. Three years of daily readings as we pulled them, 2023 through 2025, which NRCS flags provisional and subject to revision (U.S. Department of Agriculture, Natural Resources Conservation Service, n.d.).
Two things about that record before any number comes out of it. The soil values are a single instantaneous reading taken at the start of each day, while the air value is a true daily average. And the sensors at 2 and 4 inches swing so much between afternoon and dawn that a start-of-day sample sits near the bottom of that swing. So the numbers below come from the 8, 20, and 40 inch sensors. The 4-inch figure appears once, for comparison, and only as a lag rather than a temperature.
How Far Behind the Air the Soil Runs
Fit an annual curve to each depth and to the air, and the distance between their peaks is the lag.
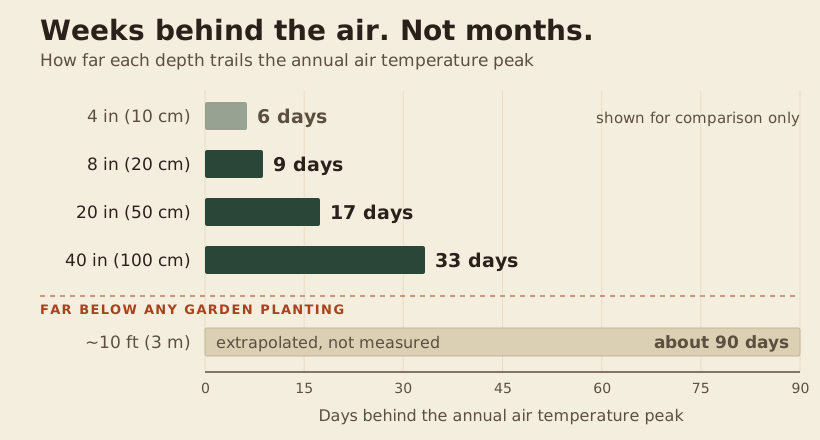
Nine days at 8 inches. Seventeen at 20 inches. Thirty-three at 40, deeper than most garden planting reaches.
So: weeks. About nine days at the depth a transplant's rootball sits, two and a half weeks at the bottom of a shrub's root zone. Those four points fall on a straight line at roughly three quarters of a day per inch, which is the shape conduction theory leads you to expect. Run that line down and you'd need about ten feet (3 m) before the soil was three months behind the air. That last step is our extrapolation, not a measurement, since the deepest sensor here is at 40 inches.
This isn't a quirk of one station. A Romanian study across ten stations, measuring the exact depths gardeners care about, found the annual signal arriving 0 to 30 days late through the first 39 inches (1 m) of soil (Demetrescu et al., 2007). A four-year German record puts the lag at 0 to 5 days at 2 inches (5 cm) and 6 to 14 days at 18 inches (45 cm) (Jarrah et al., 2022). Those two German figures are ours, from subtracting the paper's air row out of its phase-shift table; the paper's own prose rounds them to "less than 24 hours" and "about one month." The shallow sensors agree to within a couple of days. At garden depth Vallecitos runs 20 to 30% past the top of the German band, depending on how you match the depths. Call it agreement on the size of the thing and not on the number.
The reason the lag is modest is that it doesn't start at the surface. Twenty years of soil temperature at Fargo, North Dakota shows the annual swing at the ground surface running about 20% smaller than the air's and arriving at about the same time (Smerdon et al., 2003). Lag accumulates with depth. It doesn't come free at the ground line.
"Two and a half weeks behind" describes when the seasonal peak arrives. It does not mean your soil reading tracks the air temperature from two and a half weeks ago. The daily swing damps out far faster. Jacobs et al. (2011) measured a daily damping depth of about 4 inches (0.10 m), which works out to the daily wave still carrying roughly 37% of its surface size at that depth. That last step is our arithmetic, not theirs. Soil at rooting depth is steadier than air hour to hour and weeks behind it season to season. Mix the two up and your probe will look like it's contradicting everything here.
One more result, and it goes the opposite way from the story. The popular version has soil swinging less than air across the year. At 8 inches it swings more, about 1.10 times as far as the air does, and only at 20 inches and below does it damp down. The German record shows the same thing near the surface (Jarrah et al., 2022). The ground absorbs direct radiation that the air does not, so it works harder in both directions.
The Lag, in a Form You Can Use
Two and a half weeks doesn't sound like much. Here's what it does.
Take the same three years and sort the days by air temperature instead of by calendar month. Then ask: on days when the air averaged 55 to 60 °F, what was the soil doing in spring, and what was it doing in autumn?
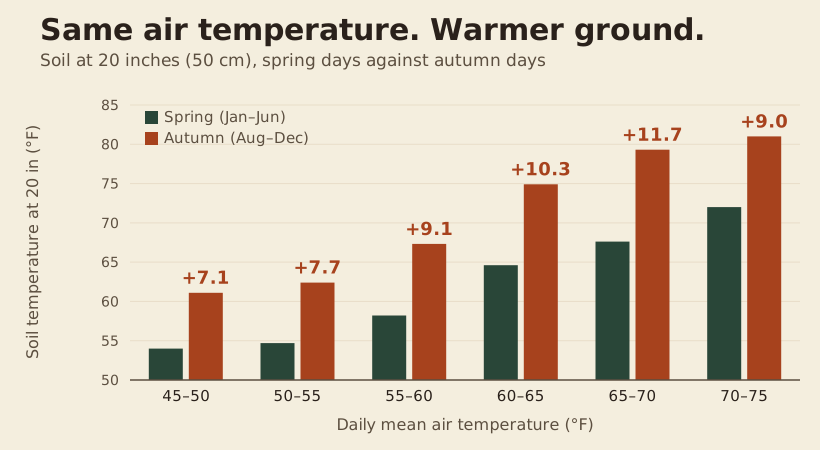
Autumn soil is warmer than spring soil at the same air temperature, in every band at every depth, pooled across the three years. 4.5 to 8.2 °F at 8 inches, and 7.1 to 11.7 °F at 20 inches. The air reading is the same on both days. What the roots are sitting in is not.
Why That Isn't a Second Finding
It's the lag, restated. Plot a year of soil temperature against the air above it and the line doesn't retrace its own steps. It opens into a loop, because the soil reaches each temperature about two and a half weeks after the air does.
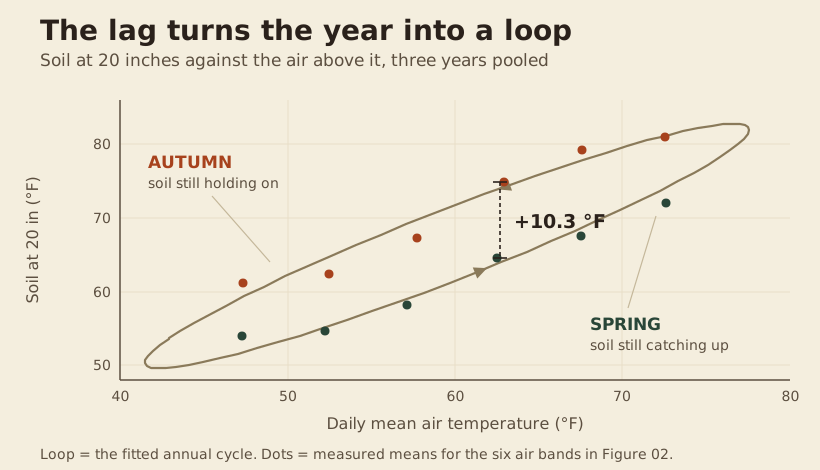
The bottom of the loop is spring, when the soil is still catching up to the air. The top is autumn, when it's still holding on. Run the numbers and the lag and the size of the swing together account for 73% of the gap at 8 inches, 88% at 20 inches, and 99% at 40. The deeper you go, the more completely the lag explains it.
That matters for how you read the number. The small lag and the large autumn gap are the same fact, so you can't use one to wave off the other. The gap is the lag. Two things hold together here: the offset is smaller than the folklore claims, and it still puts your soil somewhere different in November than in March.
What This Can't Tell You
The pooled numbers hide a big spread. At 20 inches the gap ran +6.7 to +15.9 °F in 2023 and +7.8 to +15.2 in 2024, but only +0.5 to +7.9 in 2025. The direction held every band, every year at that depth. At 8 inches it didn't: in 2025 four of six bands went the other way, autumn running as much as 4.9 °F cooler than spring.
Moisture is the likeliest culprit. Dry soil warms faster than wet soil, and the same record shows April soil at 8 inches averaging 65.6 °F in 2025 against 52.9 °F in 2023, on an air-temperature difference of under 3 °F. The file has no moisture column, so that reading is inference. But it points somewhere practical: if you water through September your beds are wetter than this station's were, and you should expect a smaller gap than the chart shows.
Vallecitos sits about 89 miles (143 km) southeast of San Jose, inland at 1,620 feet (494 m), and it runs hotter and drier than the Santa Clara Valley. Its air temperature swings about 36 °F across the year; San Jose's swings less, though we couldn't find a figure we trust for how much less. Three years is a short record and those three differ a lot. NRCS flags the whole file provisional. The site's ground cover and irrigation aren't documented, so don't read these as the temperatures under an unirrigated garden bed.
What transfers and what doesn't. The lag is mostly a property of the soil, so its rough size should carry to your yard. The size of the spring-versus-autumn gap does not. That gap scales with how wide the local temperature swing is, and San Jose's is narrower. Expect the same direction and a smaller number. We can't tell you how much smaller. Since first publishing this we have pulled that record. Three California Irrigation Management Information System (CIMIS) stations have covered Santa Clara County: San Jose and Morgan Hill, both long since disconnected, and Gilroy, which is still reporting. Together they give 13,793 days of paired air and soil readings. They put the local soil-over-air offset at about 1.4 °F in January rising to 6.0 °F in July, which is the seasonal shape this article predicts. The caveat above still stands and is the reason we treat those figures as a floor rather than an answer: all three sit on mown, irrigated turf, which is close to the least transferable stand-in there is for an autumn garden bed. The numbers are put to work in the Santa Clara County planting calendar.
One further caution, and it cuts against the case for autumn planting rather than for it. At one of its ten stations, the Romanian study found summer and autumn readings about 3 feet (1 m) down running cooler than the conduction model predicted. The authors attribute that, tentatively, to cooling as water evaporates from the soil and moves off through plants, plus air movement within the soil itself (Demetrescu et al., 2007). They flag it rather than claim it, and it's one station out of ten. But a summer-dry Mediterranean soil is exactly where that departure should show up.
What It Means for Planting
Two numbers from this record do practical work. At 20 inches the working low is 49 °F. The record shows 42 °F, but every reading under 49 came from one two-day stretch bracketing a known sensor failure, so that pair is out. At 8 inches the soil spent 140 of the 1,093 days below 50 °F, with a low of 43 °F.
Both depths stayed above about 41 °F in all three years. That's the soil temperature below which root elongation stopped in the cleanest controlled test available, run on willow oak seedlings whose own authors flag them as unlike most temperate species measured so far (Kressuk et al., 2025). A non-UC extension handbook puts the woody-plant floor at 40 °F independently (Bradley & Fair, 2022). The 4-inch sensor does read 40 °F once, under that floor, but that column is a start-of-day sample sitting near its daily low, so the true daily mean there is higher.
That's the fact a fall-planting argument actually needs from soil temperature, and it's a smaller, duller fact than "the soil holds summer's heat." It's also the one that survives being checked.
The case for planting in autumn also rests on winter rain, on roots and shoots keeping separate schedules, and on field trials that mostly favor fall. That's the other piece.
The soil runs nine days behind the air at 8 inches and two and a half weeks at 20, not three months. That's still worth having, and it's worth stating correctly.
Bradley, L., & Fair, B. (2022). Woody ornamentals (Chapter 11). In K. A. Moore & L. K. Bradley (Eds.), North Carolina Extension gardener handbook (2nd ed., Publication AG-831). NC State Extension. https://content.ces.ncsu.edu/extension-gardener-handbook/11-woody-ornamentals
Demetrescu, C., Nitoiu, D., Boroneanț, C., Marica, A., & Lucaschi, B. (2007). Thermal signal propagation in soils in Romania: Conductive and non-conductive processes. Climate of the Past, 3(4), 637–645. https://doi.org/10.5194/cp-3-637-2007
Jacobs, A. F. G., Heusinkveld, B. G., & Holtslag, A. A. M. (2011). Long-term record and analysis of soil temperatures and soil heat fluxes in a grassland area, The Netherlands. Agricultural and Forest Meteorology, 151(7), 774–780. https://doi.org/10.1016/j.agrformet.2011.01.002
Jarrah, M., Mayel, S., Franko, U., & Kuka, K. (2022). Effects of agricultural management practices on the temporal variability of soil temperature under different crop rotations in Bad Lauchstaedt–Germany. Agronomy, 12(5), Article 1199. https://doi.org/10.3390/agronomy12051199
Kressuk, J. M., Collins, J. T., Gardiner, E. S., Bataineh, M. M., & Babst, B. A. (2025). Willow oak (Quercus phellos) seedling roots continue respiration and growth during fall and winter in a soil temperature-dependent manner. Tree Physiology, 45(1), Article tpae154. https://doi.org/10.1093/treephys/tpae154
Smerdon, J. E., Pollack, H. N., Enz, J. W., & Lewis, M. J. (2003). Conduction-dominated heat transport of the annual temperature signal in soil. Journal of Geophysical Research: Solid Earth, 108(B9), Article 2431. https://doi.org/10.1029/2002JB002351
U.S. Department of Agriculture, Natural Resources Conservation Service. (n.d.). Soil Climate Analysis Network (SCAN) site 2234, Vallecitos, San Benito County, California: Daily soil and air temperature, 2023–2025 [Data set]. National Water and Climate Center. Retrieved August 30, 2026, from https://wcc.sc.egov.usda.gov/nwcc/site?sitenum=2234&state=ca NRCS flags this record provisional. Soil values are start-of-day instantaneous readings; air is a true daily mean. Every fit, comparison and minimum in this article is The Planters’ Guild’s own arithmetic on that file — not a finding published by NRCS, and not peer reviewed. Method: least-squares fit of the first annual harmonic to day-of-year, pooled over three years, with the 2025-11-20 reading at 20 inches (29 °F, between neighbors of 59 and 42 °F) removed as a sensor failure. The adjacent 2025-11-21 reading of 42 °F is treated as part of the same fault where a minimum is quoted.
Note on University of California sources. None is cited here. The Guild’s standing practice is to source from peer-reviewed literature, standards bodies, non-UC extension services and botanical institutions first, and to disclose any University of California source it uses.